
(TM types: Membrane anchors, Functional TM helices, SCOP Alpha helices , your TMs)
Note that the results in this help page were generated from the example sequence rhodopsin (P02699) on the main page of the TMSOC webserver. The length and positions of each TM segment can either be (1) user-defined or (2) computationally predicted. For prediction, the length and positions of each TM segment were derived from the results of 5 TM predictors (TMHMM, HMMTOP, DASTM, PhobiusTM, SAPS) that were statistically combined (See page 13~14 of Wong et.al. 2010 PLoS Computational Biology 6(7) for the TM prediction methodology).
1. Sequence overview
MNGTEGPNFYVPFSNKTGVVRSPFEAPQYYLAEPWQFSMLAAYMFLLIMLGFPINFLTLY
VTVQHKKLRTPLNYILLNLAVADLFMVFGGFTTTLYTSLHGYFVFGPTGCNLEGFFATLG
GEIALWSLVVLAIERYVVVCKPMSNFRFGENHAIMGVAFTWVMALACAAPPLVGWSRYIP
EGMQCSCGIDYYTPHEETNNESFVIYMFVVHFIIPLIVIFFCYGQLVFTVKEAAAQQQES
ATTQKAEKEVTRMVIIMVIAFLICWLPYAGVAFYIFTHQGSDFGPIFMTIPAFFAKTSAV
YNPVIYIMMNKQFRNCMVTTLCCGKNPLGDDEASTTVSKTETSQVAPA
(TM classification: complex-TM, twilight-TM, simple-TM)
Explanation:
First of all, the classification (simple/twilight/complex) of each TMs were determined from their z-scores (See page 6~7 of Wong et.al. 2011 Biology Direct 6(57) for the z-score calculations).
With reference to the user input sequence, the complex TMs (z-scores above -3.29) were then colored in red while the simple TMs (z-scores below -5.41) in blue.
Sometimes, TM can fall into a twilight z-score range (between z-scores of -3.29 to -5.41) and they are colored in orange.
With respect to this rhodopsin sequence (P02699), we found 6 complex TMs and 1 simple TM. Indeed, the functional role of this TM-5 has not been established whereas the Gly51 in TM-1 and Gly89 in TM-2 have been linked to the retinal degenerative disease autosomal dominant retinitis pigmentosa (See J Biol Chem 2003, 278:20203-20209) while Glu113 in TM-3, Ala169 in TM-4, Trp265 in TM-6 and Lys296 in TM7 are functionally important (See Science 2000, 288:2209-2212 and J Mol Biol 2004, 343:1409-1438).
2. TM segment(s) summary
FW: aromatic residues
RDEH: charged residues
GP: structurally important residues
(based on ClustalX color code)Index Sequence Predicted TM segment Complexity Hydrophobicity Zscore Class 1 FSMLAAYMFLLIMLGFPINFLTLYVTV 37,63 2.38 5.75 -3.23 complex 2 YILLNLAVADLFMVFGGFTTTLYTSLHG 74,101 2.41 -0.89 0.29 complex 3 NLEGFFATLGGEIALWSLVVLAIERYV 111,137 2.33 -1.29 0.50 complex 4 AIMGVAFTWVMALACAAPPLVGW 153,175 2.51 1.72 0.27 complex 5 SFVIYMFVVHFIIPLIVIFFCYGQLVFTV 202,230 2.05 6.57 -5.70 simple 6 RMVIIMVIAFLICWLPYAGVAFYIFT 252,277 2.46 4.67 -2.04 complex 7 FGPIFMTIPAFFAKTSAVYNPVIYIMM 283,309 2.81 1.03 1.91 complex
Explanation:
In the above table, the first column gives the order of the TM helices with respect to the sequence, namely from the N to C-terminus.
The second column gives the sequence of each TM helix. The charged residues(RDEH), aromatic residues(FW) and structurally important residues(GP) are highlighted in each TM helix.
These residues were found to be statistically enriched in complex TMs (See page 3~6 of Wong et.al. 2011 Biology Direct 6(57) for the details on the enrichment).
The third column gives the positionally range of each TM in the sequence. These ranges can either be user-defined or predicted.
The fourth to sixth columns give the sequence complexity, hydrophobicity and z-score of each TM helix.
Finally, the last column gives the class of each TM whether simple, twilight or complex.
To further elaborate, complex TMs have z-scores above -3.29 while simple TMs have z-scores below -5.41 (at false-negative rate of 5%).
In addition, a twilight zone is declared between the z-score range of -3.29 to -5.41 for some TMs.
In essence, we try to be conservative in our declaration of simple TMs (See page 6~7 of Wong et.al. 2011 Biology Direct 6(57) for the z-score).
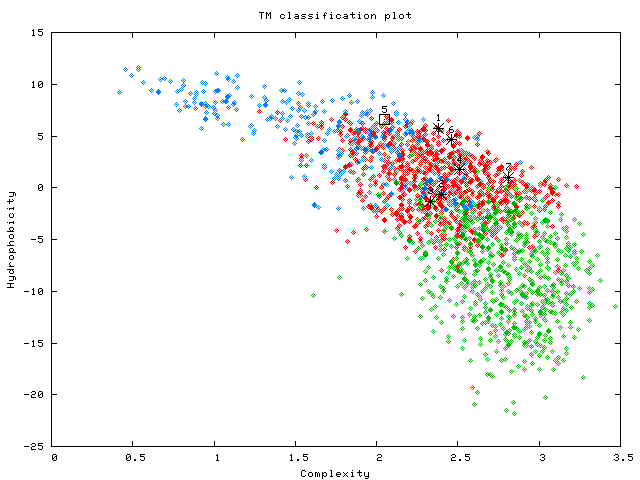
3. TM classification plot
(TM types:
Membrane anchors,
Functional TM helices,
SCOP Alpha helices
, your TMs)
Explanation:
This is a sequence complexity/hydrophobicity plot of TM sequences.
The predicted or user-defined TMs are shown in black. In particular, the simple TMs are denoted in squares while the complex TMs are marked by asterisks.
In the case of the rhodopsin (P02699) example, we expect 7 black markings in the plot (1 simple and 6 complex TMs).
For the purpose of comparison, the 'alpha helices from globular proteins' (in green)
'functional TMs' (in red) and 'membrane anchors' (in blue) are also shown in the plot.
(See page 10~13 of Wong et.al. 2011 Biology Direct 6(57) for more details on the relationships among the various helix populations).
4. Masked FASTA sequence
>P02699_Rhodopsin
MNGTEGPNFYVPFSNKTGVVRSPFEAPQYYLAEPWQFSMLAAYMFLLIMLGFPINFLTLY
VTVQHKKLRTPLNYILLNLAVADLFMVFGGFTTTLYTSLHGYFVFGPTGCNLEGFFATLG
GEIALWSLVVLAIERYVVVCKPMSNFRFGENHAIMGVAFTWVMALACAAPPLVGWSRYIP
EGMQCSCGIDYYTPHEETNNEXXXXXXXXXXXXXXXXXXXXXXXXXXXXXKEAAAQQQES
ATTQKAEKEVTRMVIIMVIAFLICWLPYAGVAFYIFTHQGSDFGPIFMTIPAFFAKTSAV
YNPVIYIMMNKQFRNCMVTTLCCGKNPLGDDEASTTVSKTETSQVAPA
Explanation:
In this version of the rhodopsin (P02699) sequence, the sequences of the simple TM was masked with 'X's. Note that twilight TMs will not be masked.
Essentially, this should be the version of the rhodopsin sequence to be used for similarity searches.
We found that appropriately masked sequence can experience a decrease in false-discovery rate without compromising the search sensitivity (See page 15~17 of Wong et.al. 2011 Biology Direct 6(57) for a description on the search performance).