|
|
Biomolecular Function Discovery Division |
|
|
|
||

MS Cleaner Version 1.0
Example for motivating application of signal processing procedures for
background removal in protein tandem mass spectra
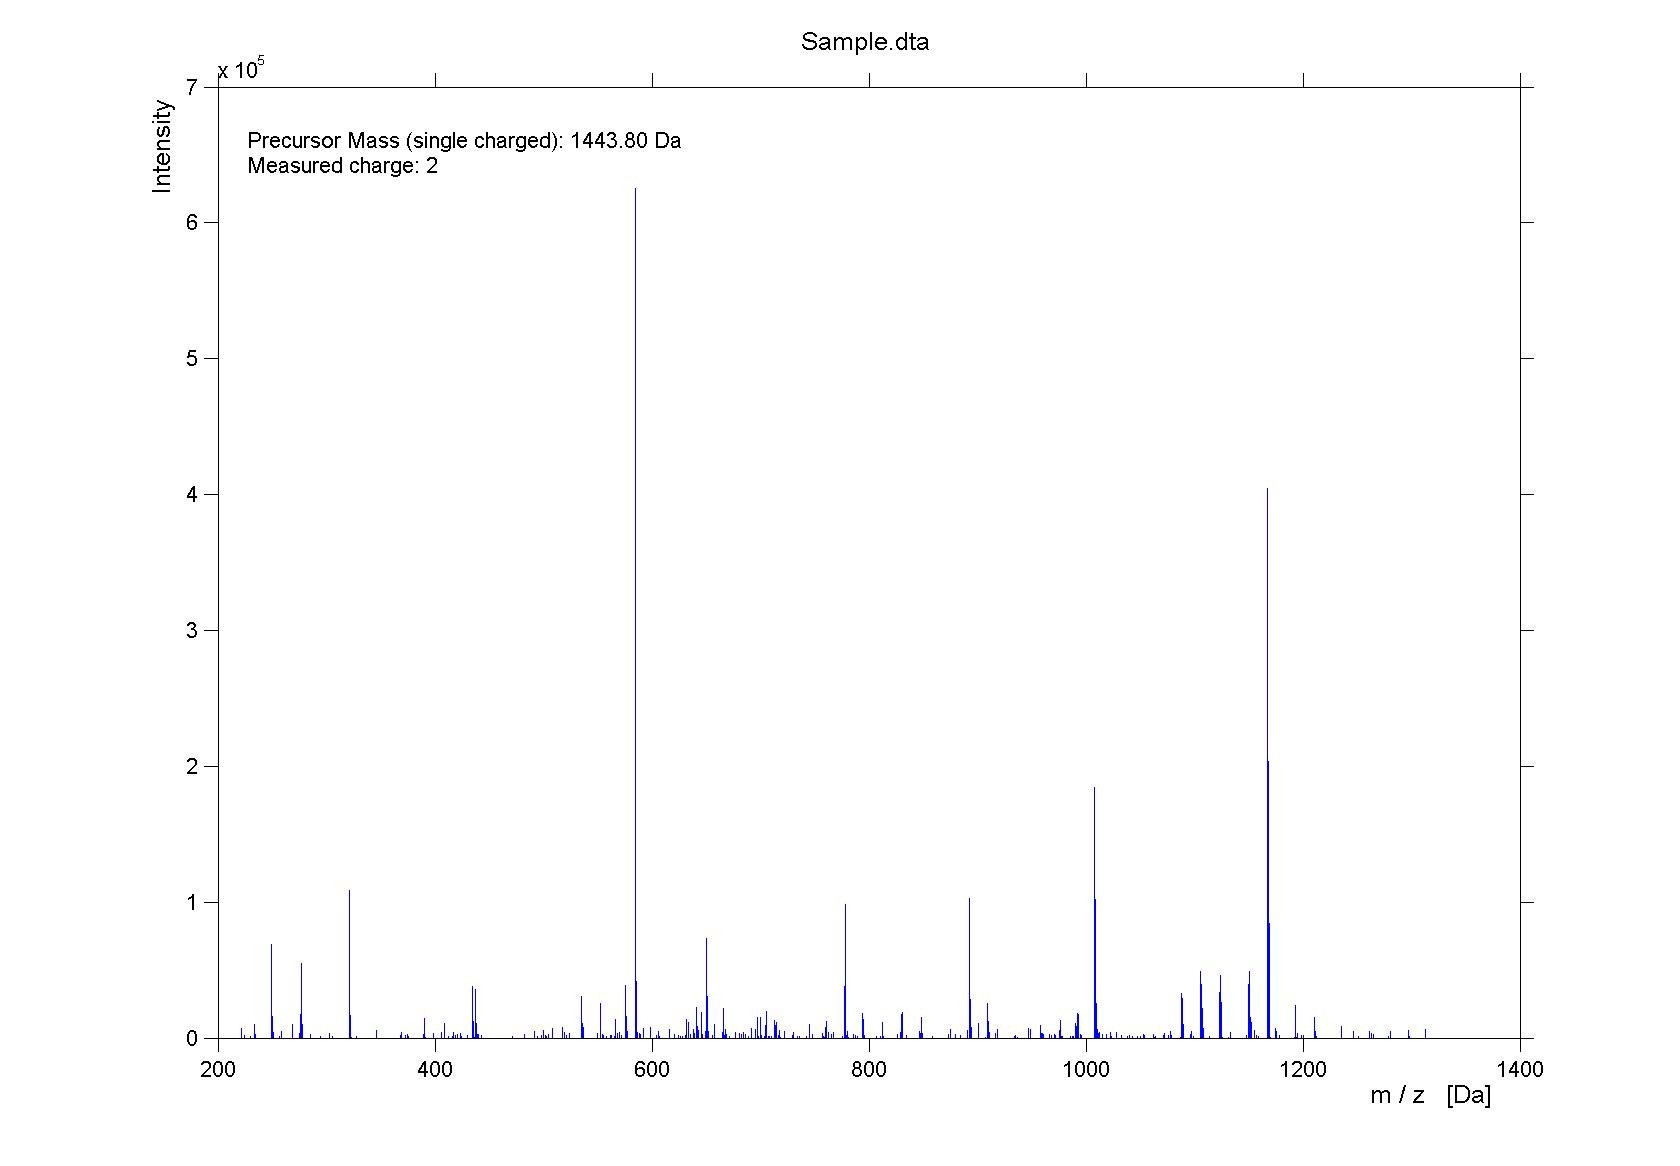
1) Mascot search of
bovine serum albumin peptide YICDNQDTISSK
- Sample file used for demonstration in .dta and it's view (Suppl.Fig. 1) in .tif and .jpg format. In the following text, this file will be called Sample.dta.
- Mascot result file
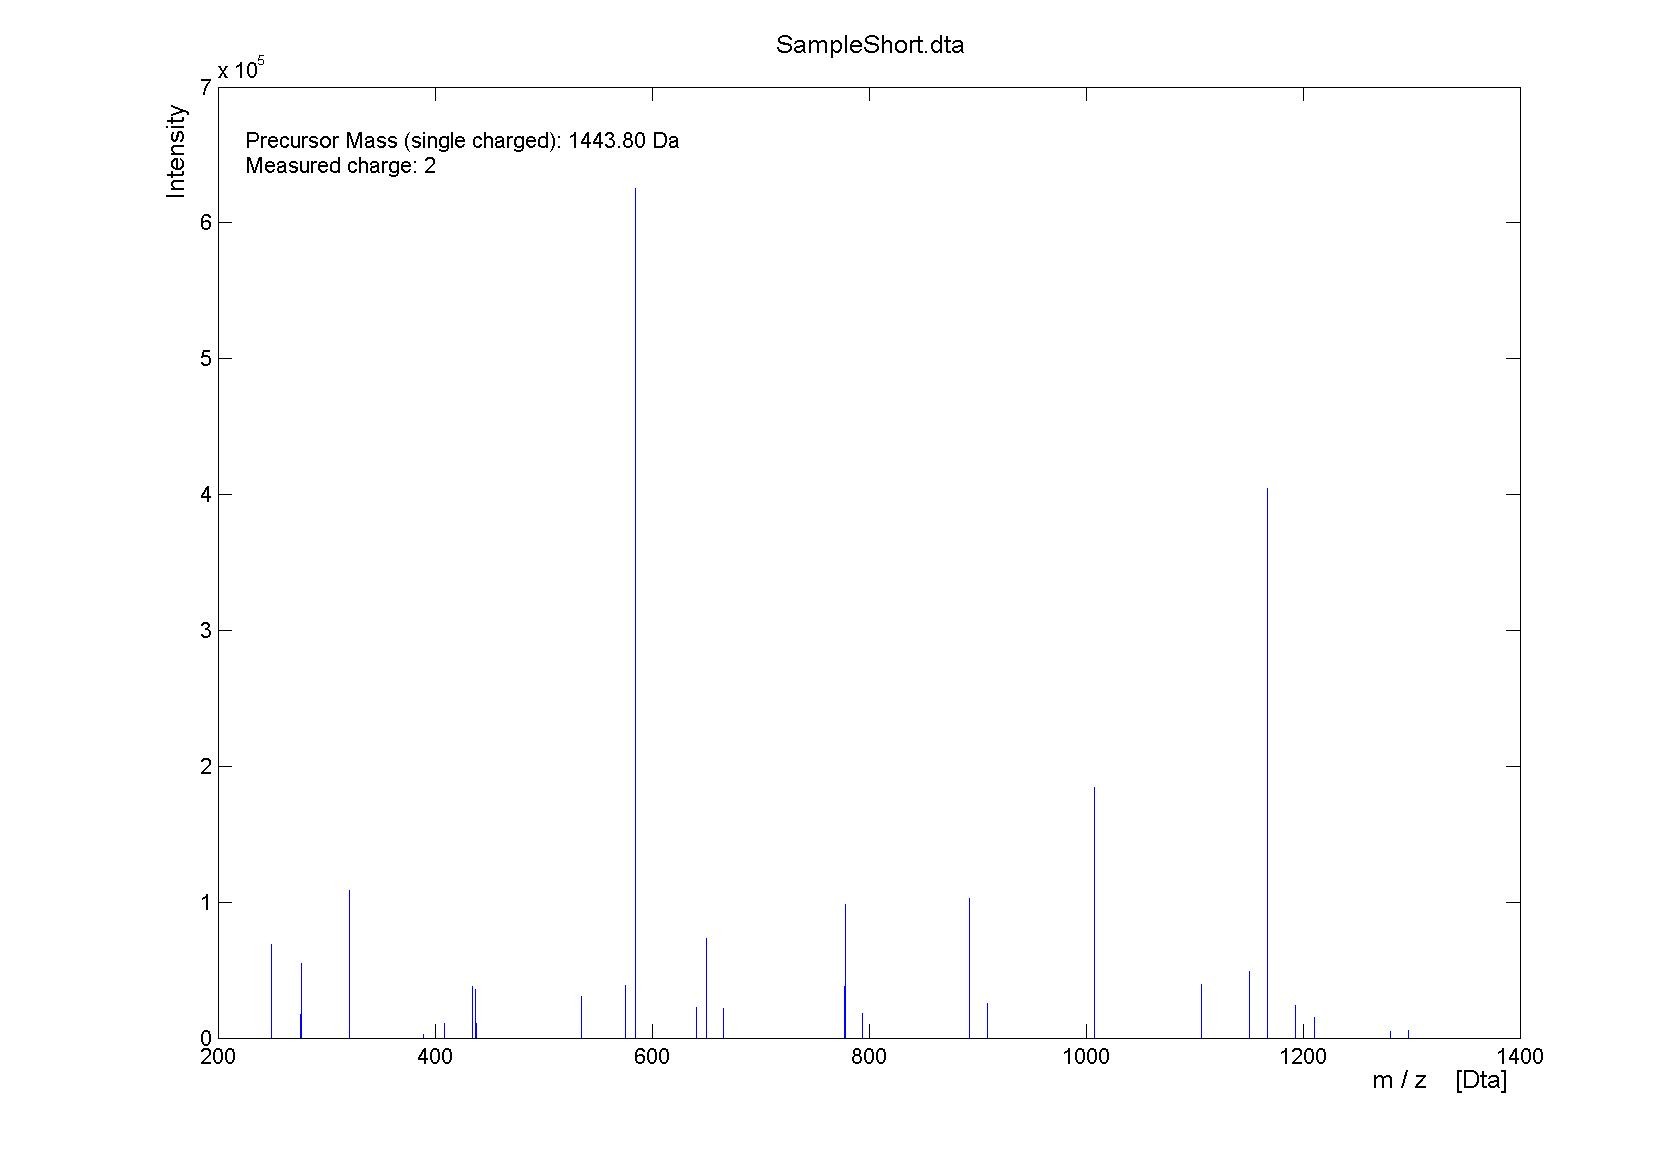
- Sample file used containing only identified peaks by Mascot in .dta format and it's view (Suppl. Fig. 2) in .tif and .jpg format. In the following text this file will be called SampleShort.dta.
2) Application of filters for latent periodic noise on protein MS/MS spectra
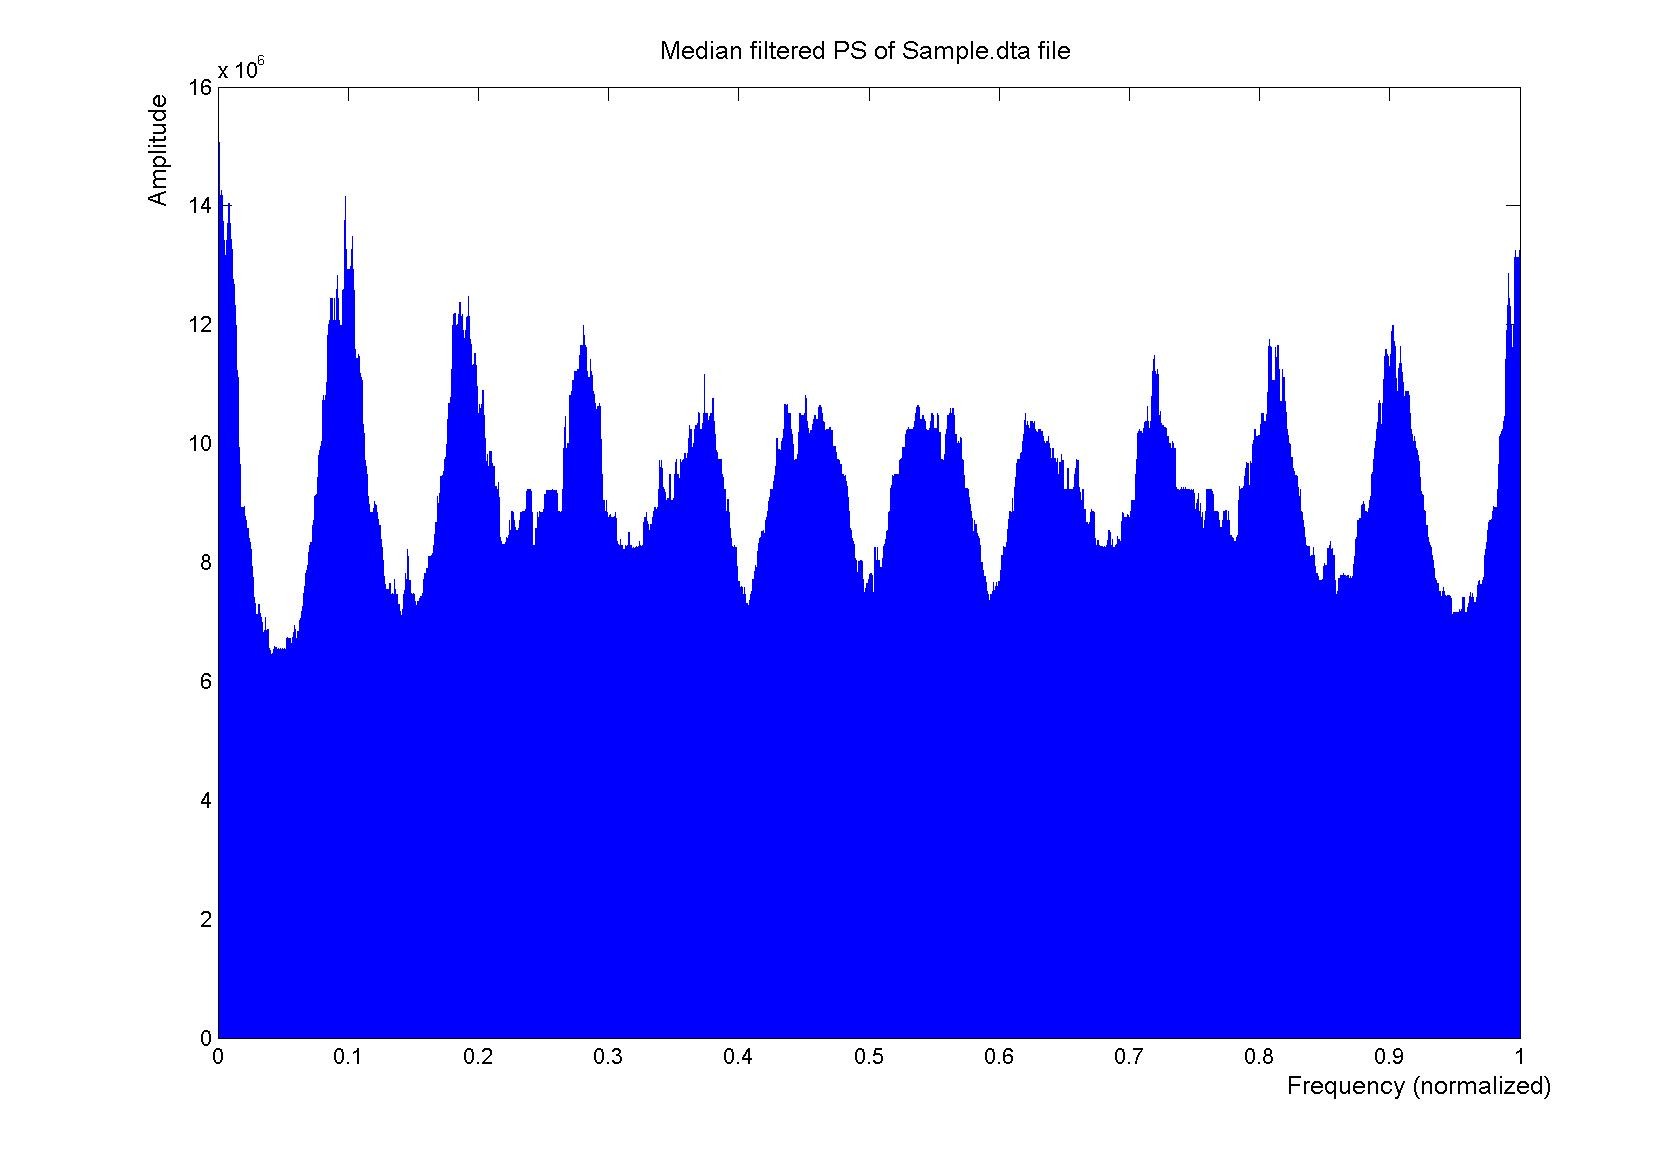
- Suppl. Fig. 3: Median filtered Power spectrum (PS) of the Sample.dta file in .tif and .jpg format.
Legend: The Suppl. Fig. 3 shows the power
spectrum derived from Sample.dta in the argument range from zero to the Nyquist
frequency. As a first approximation, the spectral intensity in the power
spectrum derived from the originally measured peaks is a periodic function of
the frequency.
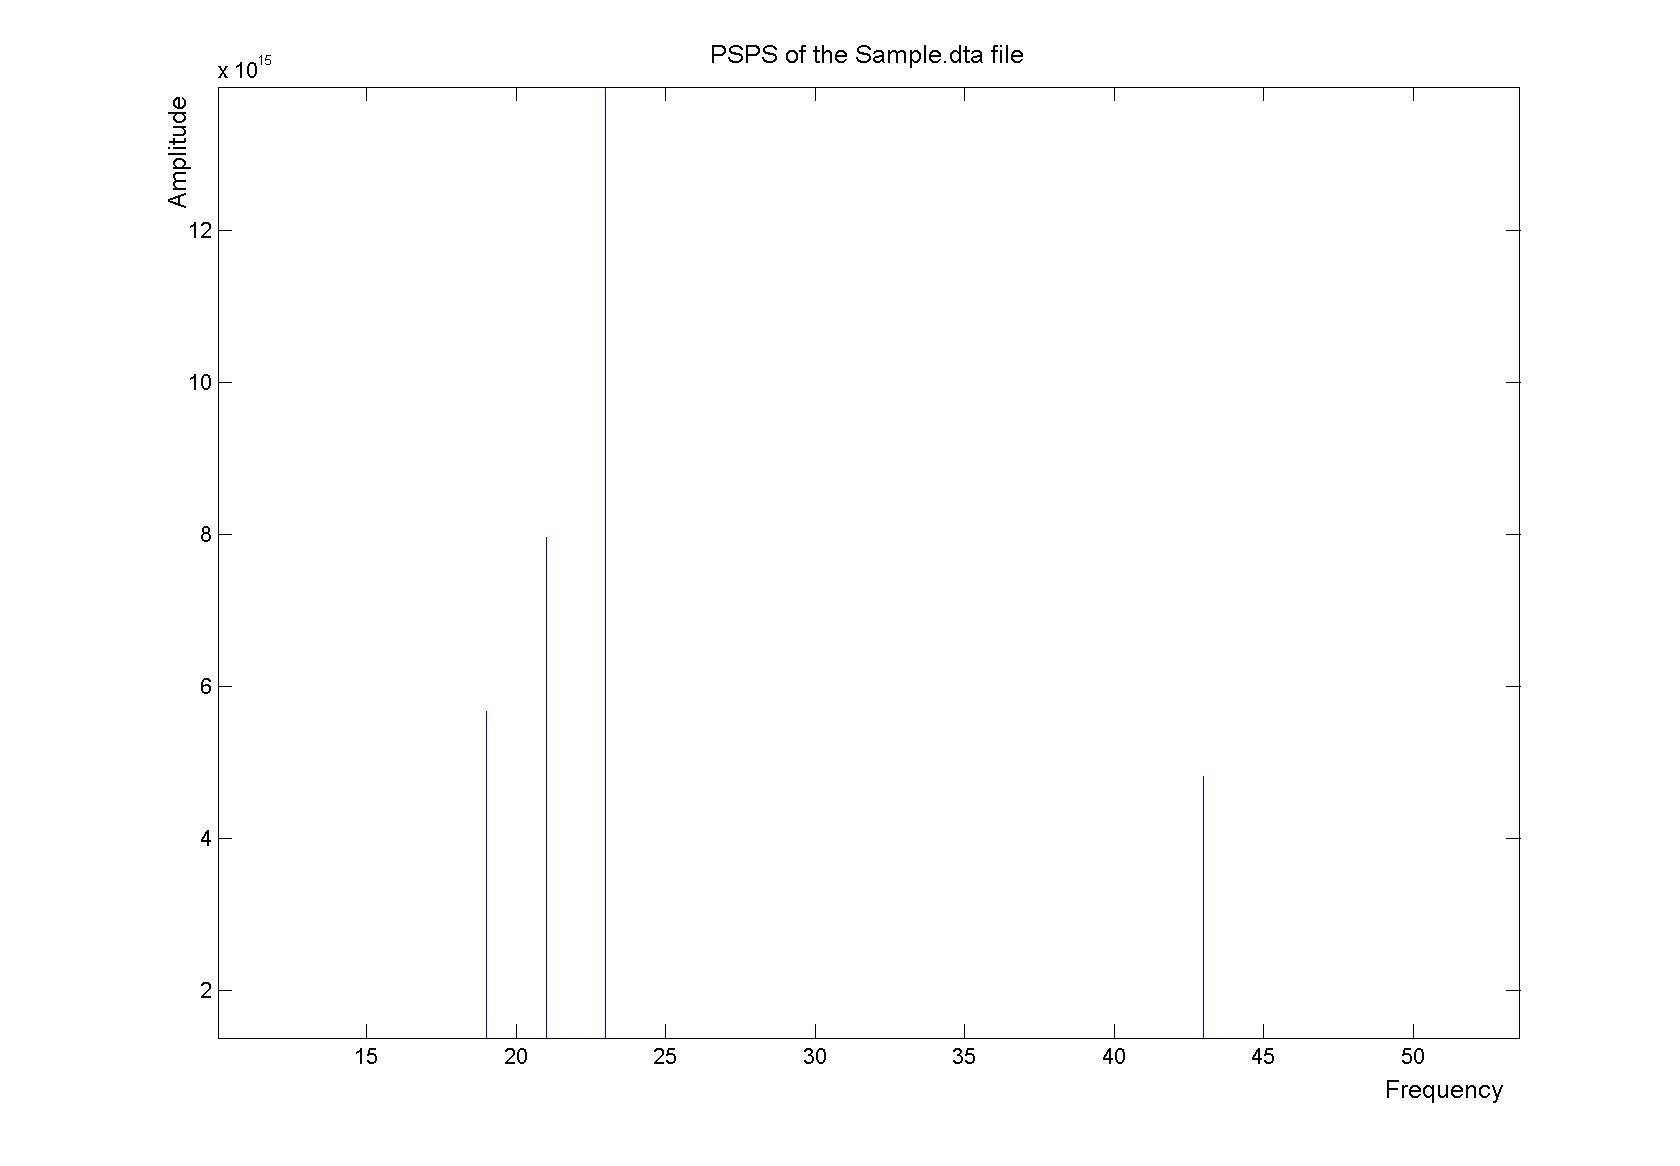
- Suppl. Fig. 4: Power spectrum of the power spectrum (PSPS) of the Sample.dta in .tif and .jpg format.
Legend: In the secondary power spectrum
calculated from the data in Suppl. Fig. 3, there are three peaks (at 19, 21 and
the highest at 23). They represent the latent number of periods in the function
shown in Suppl. Fig. 3 (but in the range from zero to the doubled Nyquist
frequency; i.e., twice the segment shown in Suppl. Fig. 3).
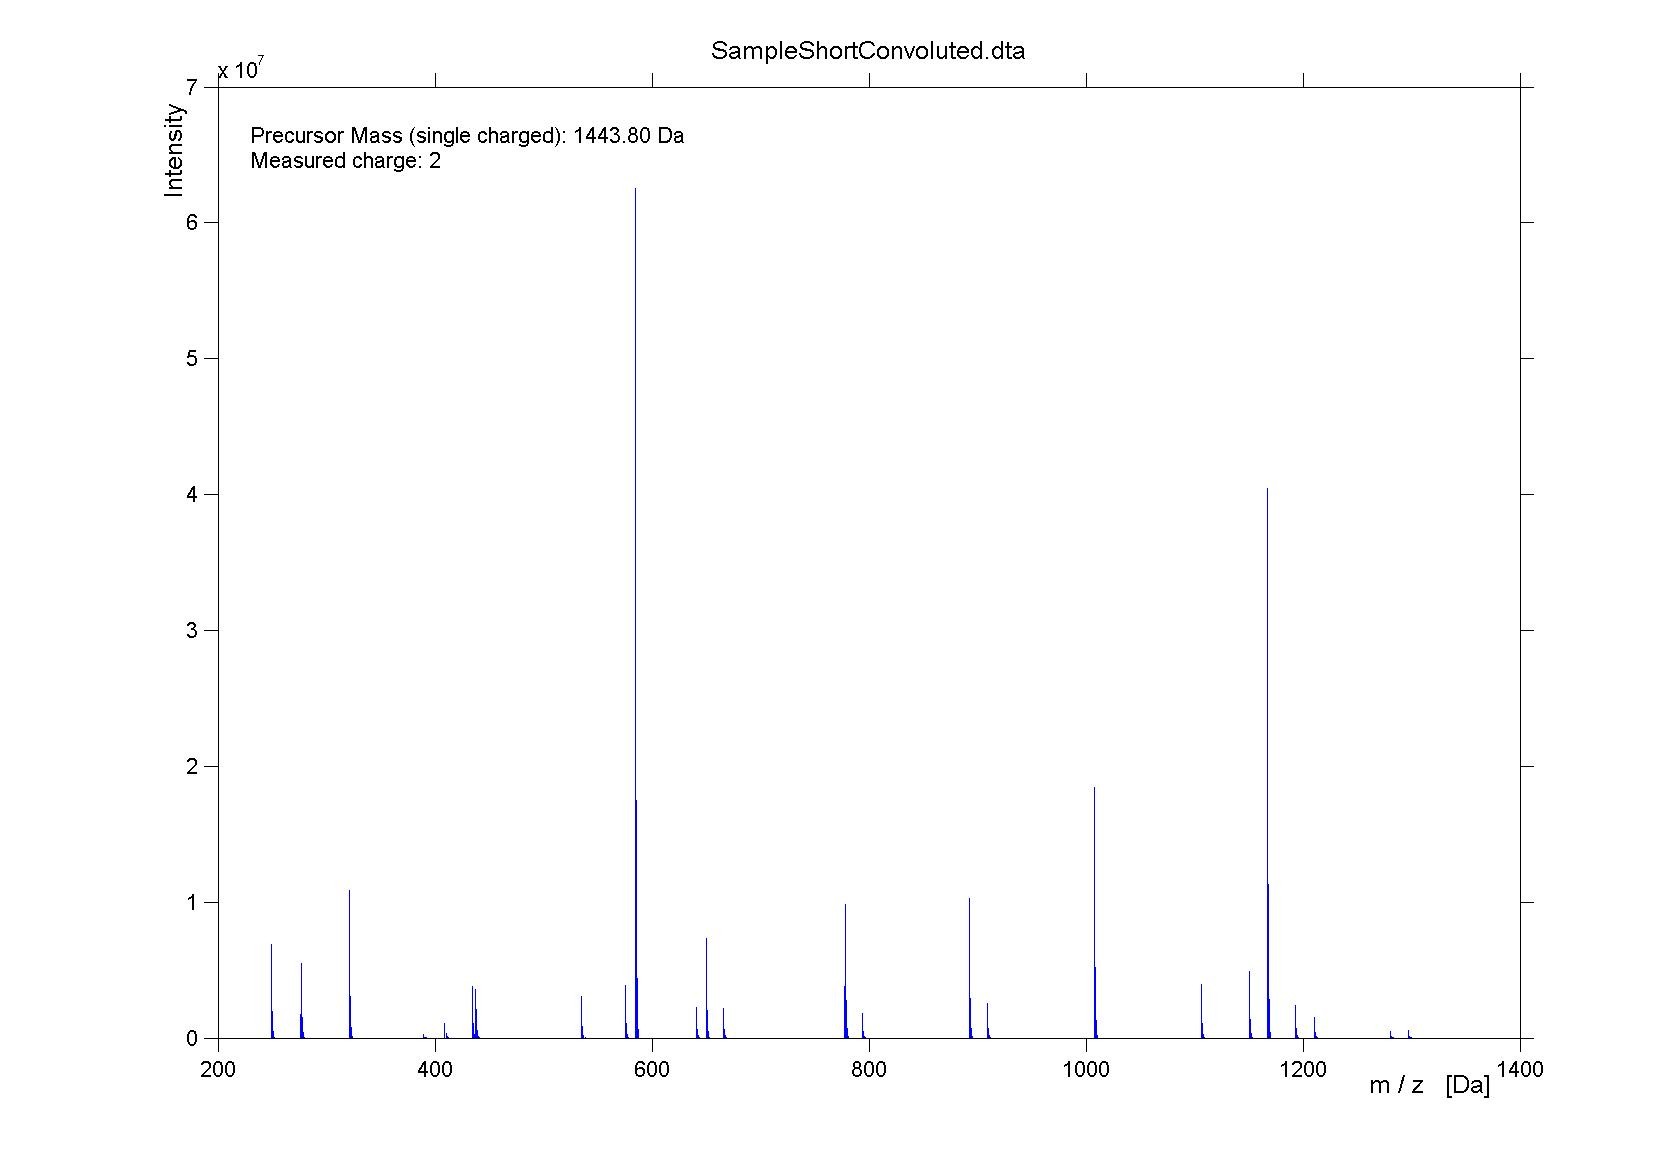
- SampleShort.dta file
convoluted by isotope muster (addition of isotope clusters to monoisotopic
peaks in Sample.dta), in .dta and
it's view (Suppl.Fig. 5)in
.tif and .jpg format. In the following
text, this file will be called SampleShortConvoluted.dta.
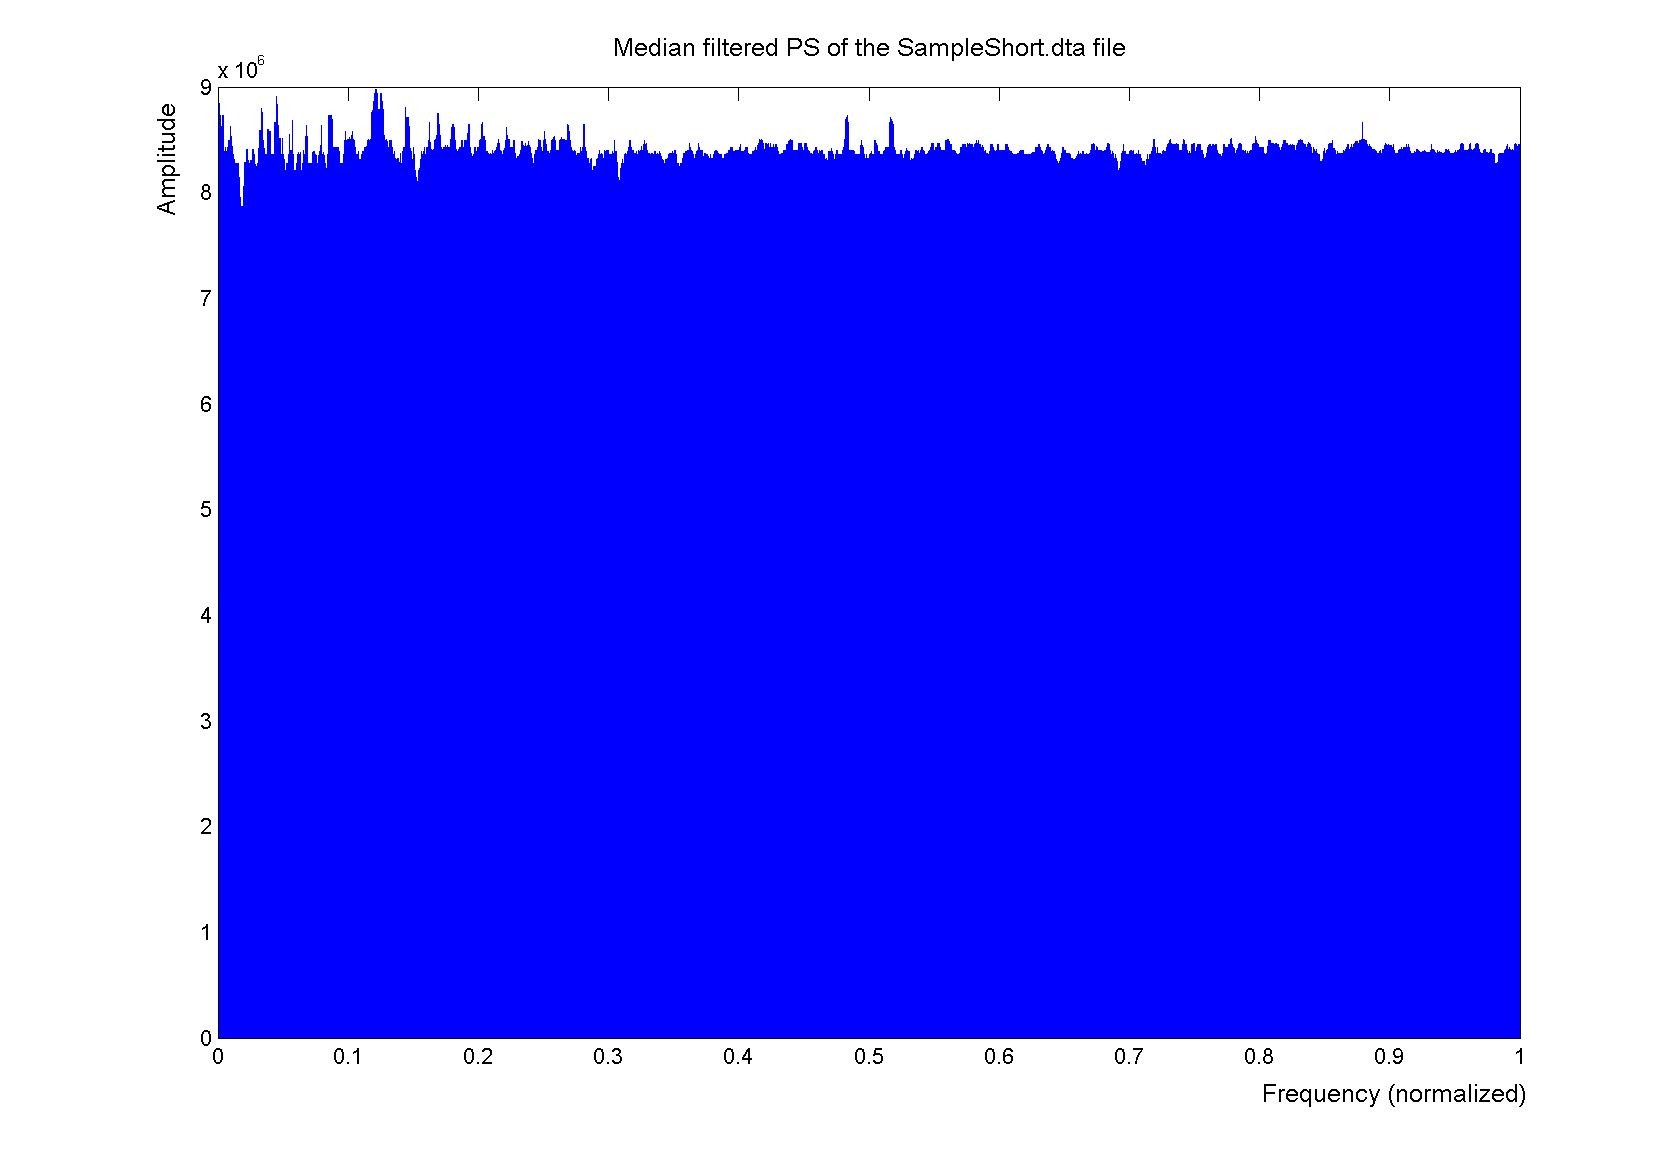
- Suppl. Fig. 6: Median filtered PS of the SampleShort.dta file in .tif and .jpg format.
Legend: Obviously, the spectral intensity in the
power spectrum derived only from the peaks that can be interpreted by MASCOT is
almost constant over the whole argument range and, especially, it does not show
any signs of periodicity.
- Suppl. Fig. 7: PSPS of the SampleShort.dta file in .tif
and .jpg format.
Legend:
The absence of latent periodicity is confirmed with the power spectrum of the
graph in Suppl. Fig. 6. There is no
prominent peak.
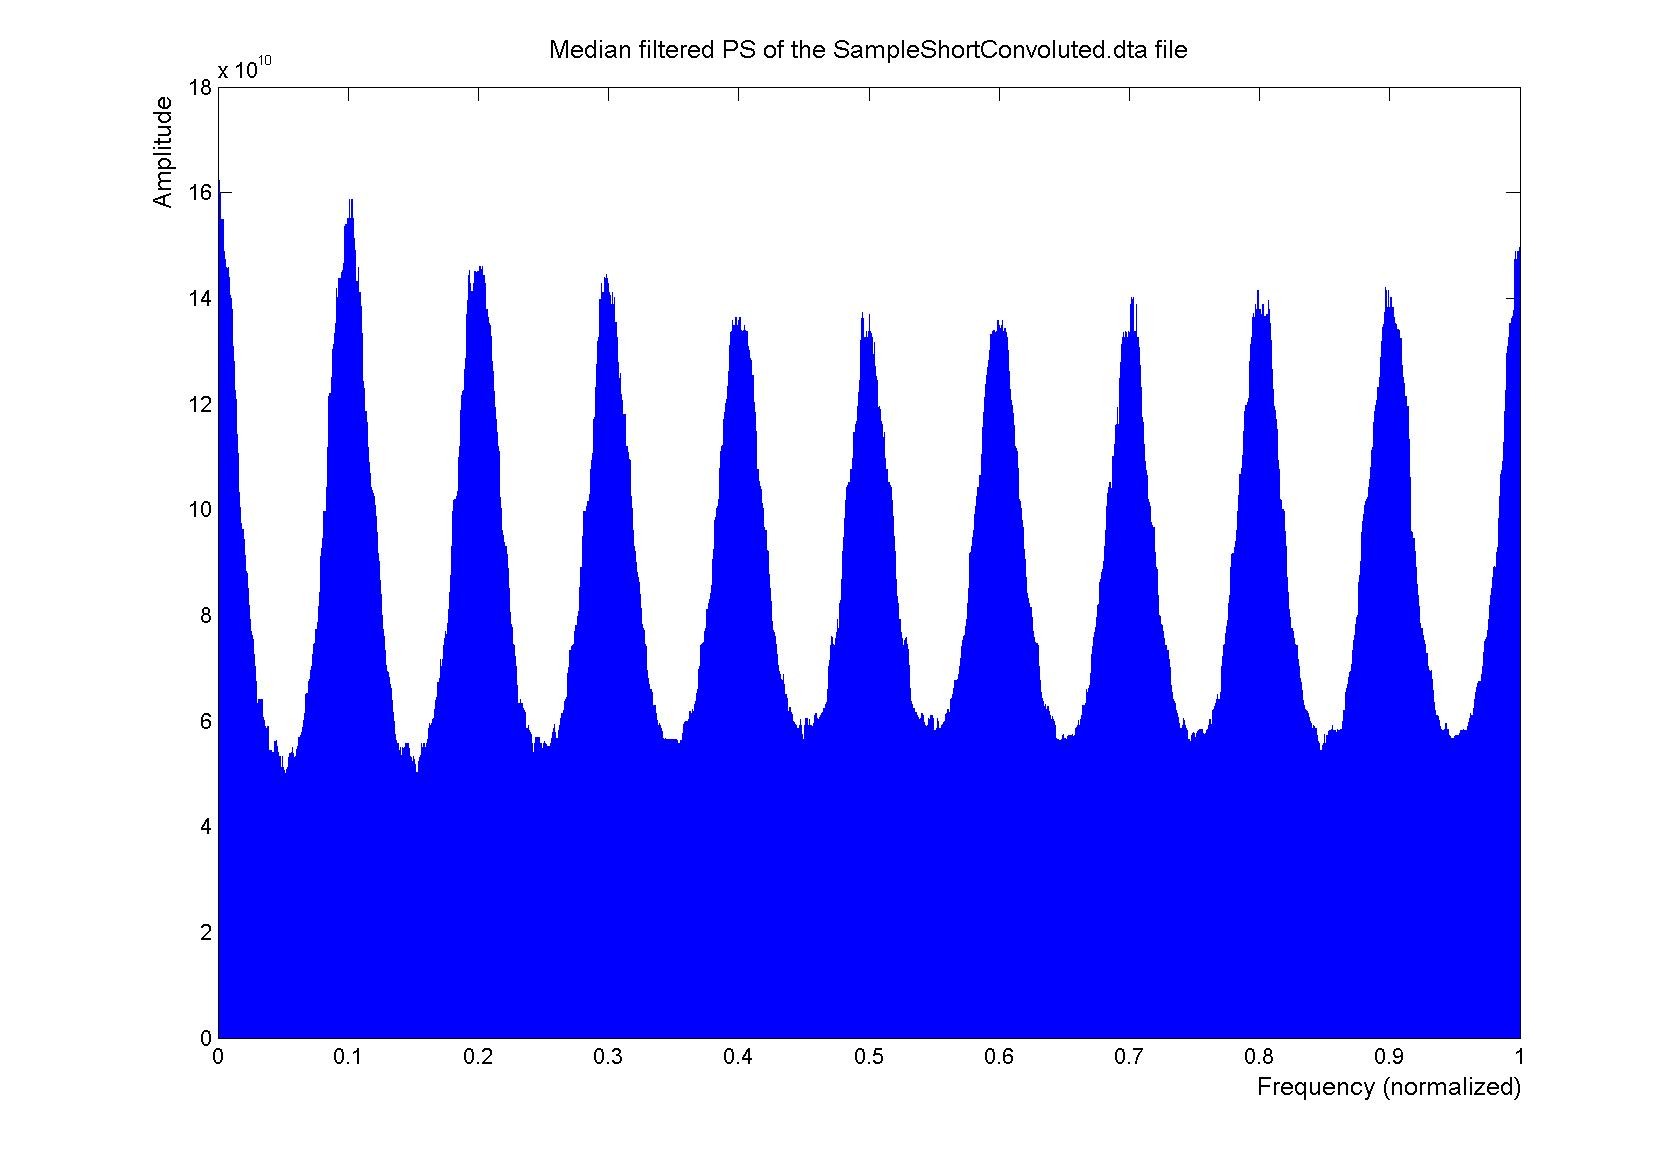
- Suppl. Fig. 8: Median filtered PS of the
SampleShortConvoluted.dta file in .tif and .jpg format.
Legend: The Suppl. Fig. 8 shows the power
spectrum derived from SampleShortConvoluted.dta in the argument range from zero
to the Nyquist frequency. As a first approximation, the spectral intensity in
the power spectrum derived from the originally measured peaks is a periodic
function of the frequency. Thus, addition of isotope clusters to monoisotope
peaks has restored periodicity of the power spectrum.
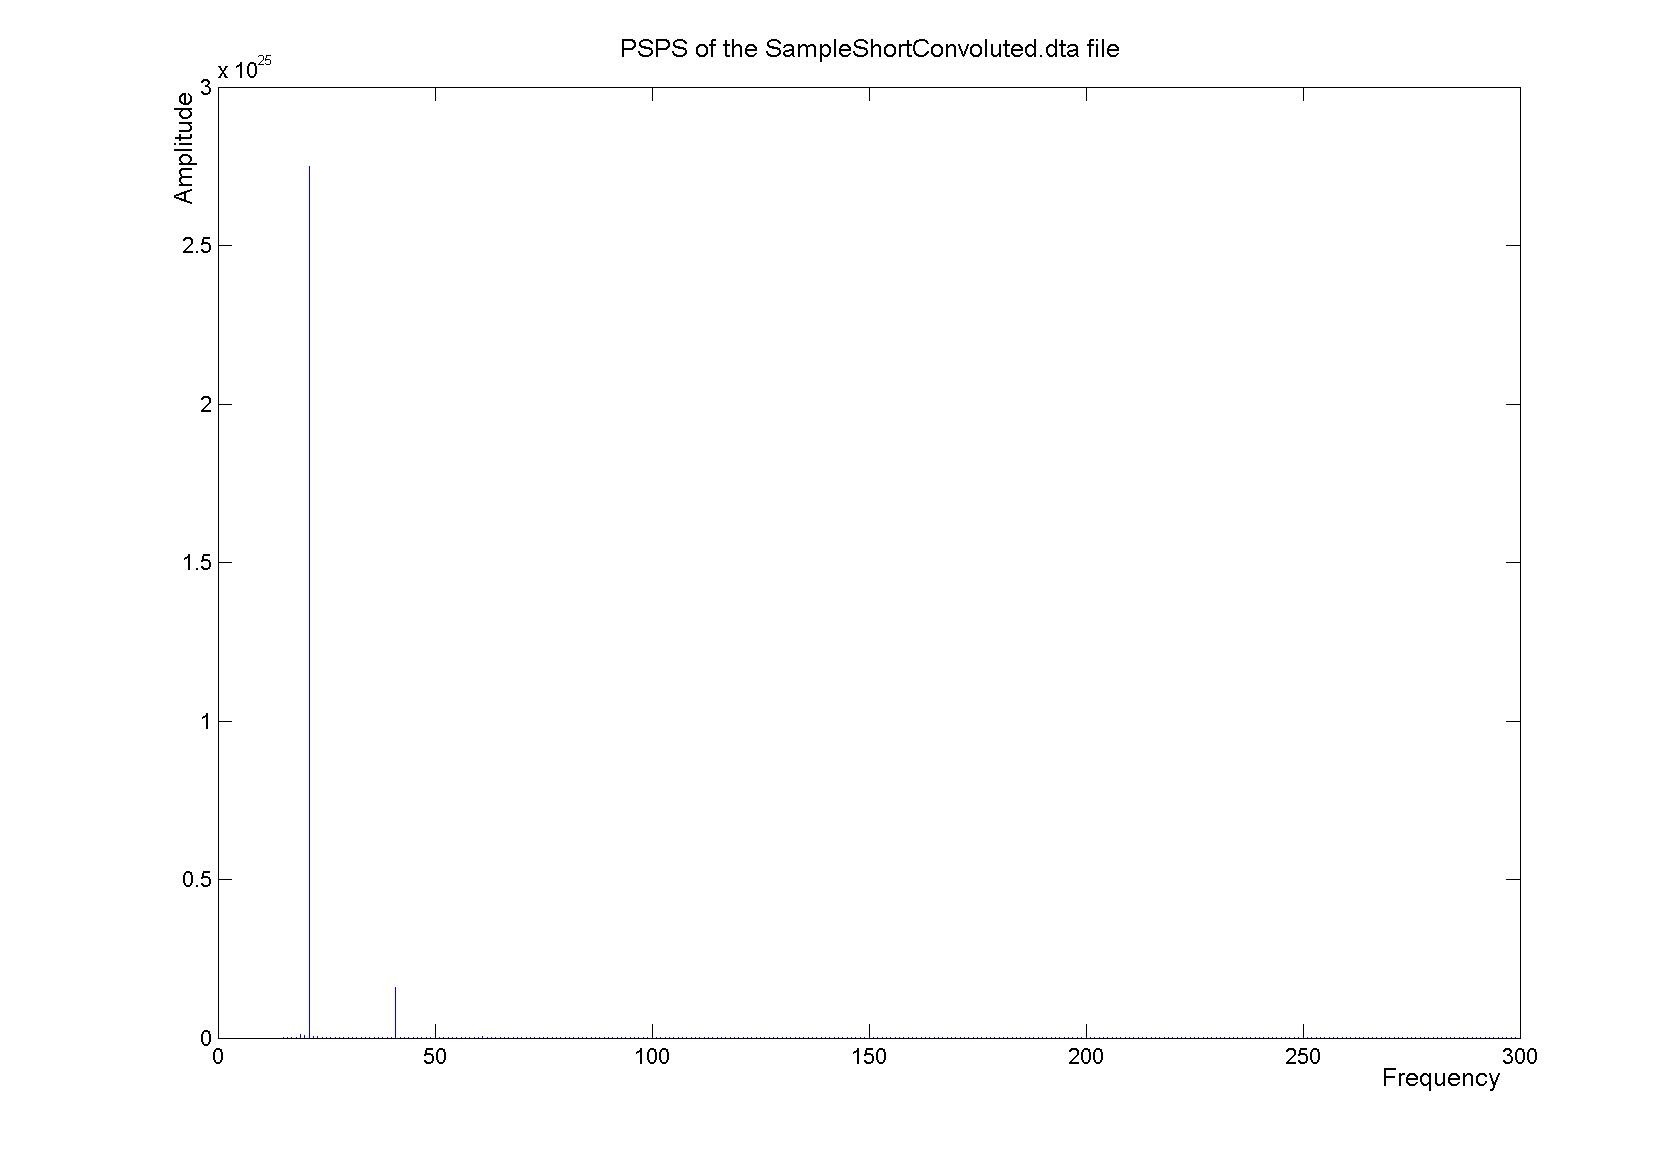
- Suppl. Fig. 9: PSPS of the
SampleShortConvoluted.dta file in .tif and .jpg format.
Legend:
In the secondary power spectrum calculated from the data in Suppl. Fig. 8,
there are several peaks (the most prominent one at 21). They represent the
latent number of periods in the function shown in Suppl. Fig. 8 (but in the
range from zero to the doubled Nyquist frequency; i.e., twice the segment shown
in Suppl. Fig. 8). Thus, the power
spectrum of the power spectrum confirms the re-appearance of periodicity in the
power spectrum.
3) Application of random noise filter on protein MS/MS spectra
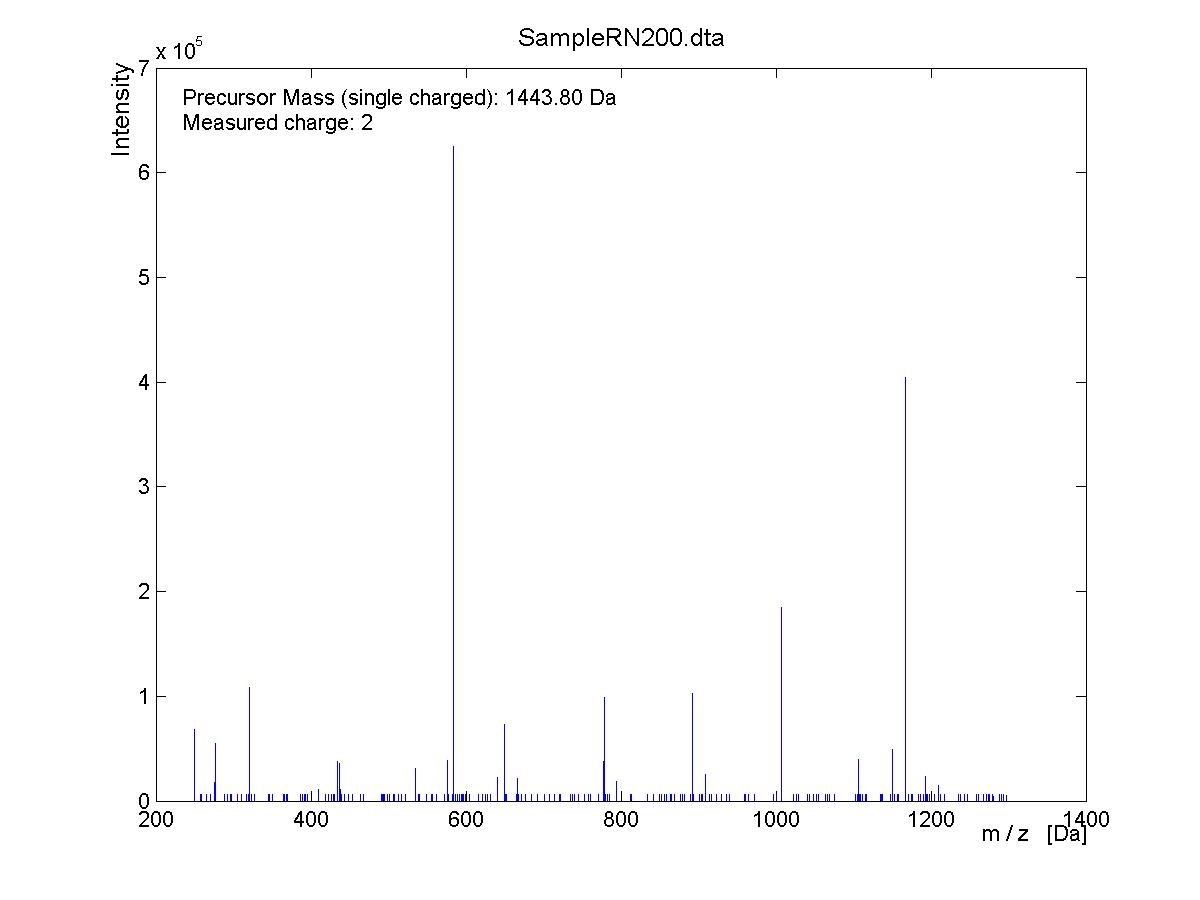
- Sample.dta with 200 random peaks added with intensity equal 1% of the highest intense peak. In the following text this file will be called SampleRN200.dta. It is assumed that the large number of low-intensity peaks will lead to high-frequency noise in the power spectrum that can be, at least, partially removed with lowpass filter.
- Suppl. Fig. 10: View of the SampleRN200.dta file in .tif and .jpg format.
Legend: The mass spectrum for the dataset
SampleRN200.dta is presented. The peaks are shown in blue.
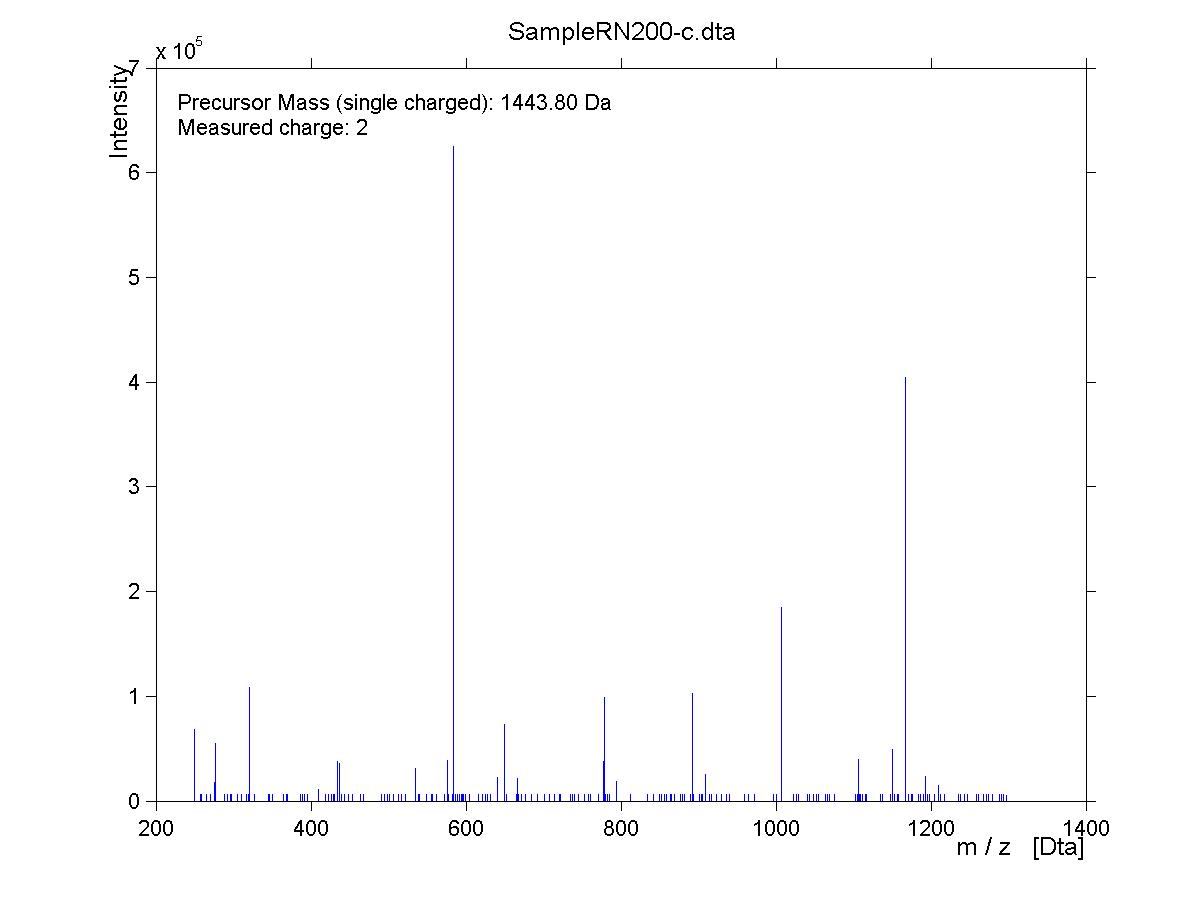
- Cleaned SampleRN200.dta file by the "MS Cleaner" with parameters described in the log file. The cleaned file will be called in the following text as SampleRN200_c.dta.
- Suppl. Fig. 11 : View of the SampleRN200_c.dta in .tif and .jpg format.
Legend: The mass spectrum for the dataset SampleRN200_c.dta
is presented. The peaks are shown in blue.
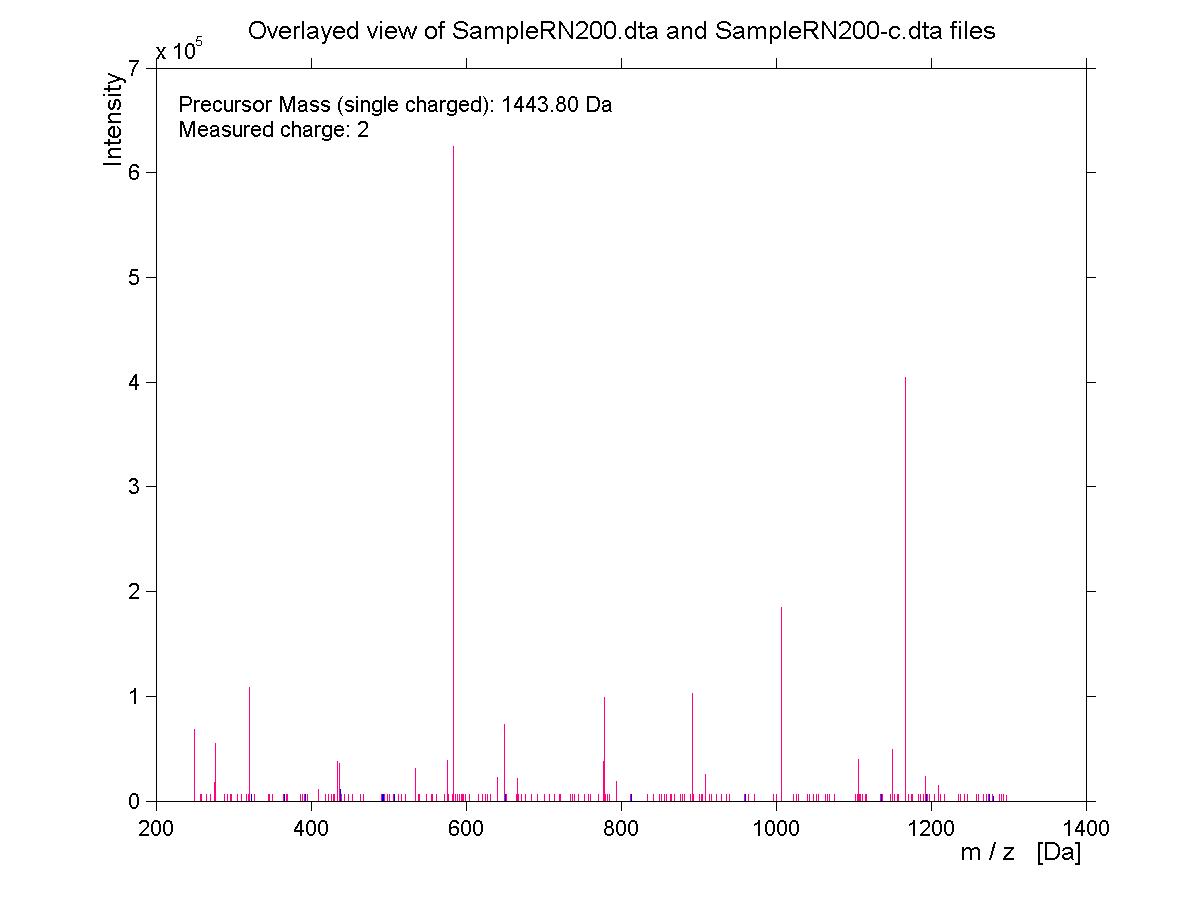
- Suppl. Fig. 12: Overlayed view of SampleRN200.dta and SampleRN200_c.dta files in .tif and .jpg format.
Legend: The mass spectra for the datasets
SampleRN200.dta and SampleRN200_c.dta are presented overlayed. The peaks from
SampleRN200.dta are shown in blue, those from SampleRN200_c.dta are presented
above them in red. All peaks remaining blue (totally 21 or 10.5% of the 200
random noise peaks, see log file) have been
removed by the lowpass filter. Additionally, the lowpass filter has removed the
small peak at 438.20889 Dalton which was interpreted by Mascot as Y*++ (Mascot result file). This peak is not essential
for the peptide identification. This case shows that the lowpass filter (if
applied with relaxed parameters) might remove some small true peaks that are otherwise
not distinguishable from the low-intensity background.