|
|
|
|
|
|
|
|
|
||
The case of false-positive rejection of MS/MS spectra
Part A
Supplementary data to single case in the transferrin sample
The single case of false-positive rejection af an MS/MS spectrum in the transferin data set
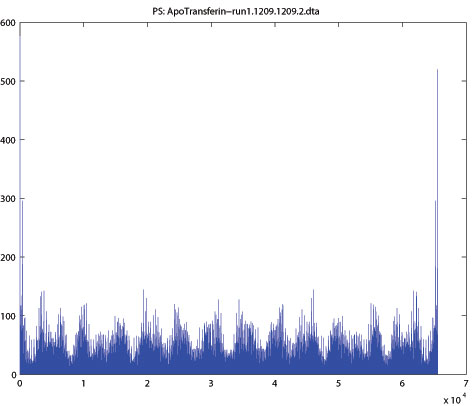
- dta file 1209.1209.2 before cleaning
- Mascot search before cleaning
- dta file after cleaning
- Log of MS Cleaner
- List of deleted peaks
- Mascot search after cleaning
This spectrum was rejected by MS Cleaner false-positively as non-interpretable because of its low base fequency in the power spectrum. The values in the criterion (equation 2) are:
- s=783.6869 (standard deviation of diepersion)
- X=2405.667 (mean of dispersion)
- Cd=0.325767 (coefficient of dispersion)
The PS-graph (shown from zero to the double of the Nyquist frequency) is obviously a quasi-periodical graph. Since Cd<3.3, the spectrum is assumed quasi-periodical. The sum of distances of real maxima and minima from their expected positions is 31805 (in spectral abscissa units), the sum of distances to the positions with shift of half a period is 34910. Since the latter is larger than the former, the spectrum was considered non-interpretable by MS Cleaner.
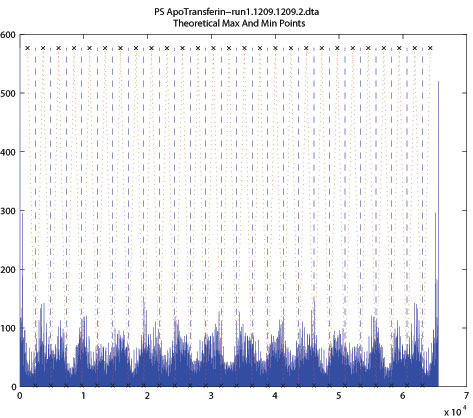
The reason is the inaccurate determination of the base frequency fB. The measured value is 27 (see the PSPS-graph); the true value is 13 (in abscissa units of the PSPS-graph), which is below the threshold fBT (here, fBT=14). As a result, the position of expected maxima and minima is not correctly calculated (see the PS-graph with expected maxima and minima added to the spectrum). The PS-graph is shown from zero to the double of the Nyquist frequency, positions of maxima are denoted with dashed lines and positions of expected minima are shown with crosses at the tip of red lines.